Phase 1: Fieldwork and Data Collection
Because of the many factors the SW CWD Study is investigating, an extensive data infrastructure was required to cover all the bases. The purpose of the capture-collar phase (Phase 1) of this project was to get the data generation machine flowing. Data from 1,249 captured animals was transmitted to project staff over the course of several years, which will help us understand survival, recruitment, and movement of deer, bobcats, and coyotes.
Information collected in the field and from the GPS collars will join other data sources, like CWD testing data. From these sources, researchers are building the components of the project’s main product, a comprehensive model called the Integrated Population Model (IPM) that will show how CWD is influencing Wisconsin's deer population. Storm said, “We’ve got a lot of good, quality data for this project. The more animals we catch, the more we can learn.” And if the 1,249 animals that were captured and collared for this study are any indication, there is a lot researchers will learn about deer and chronic wasting disease.
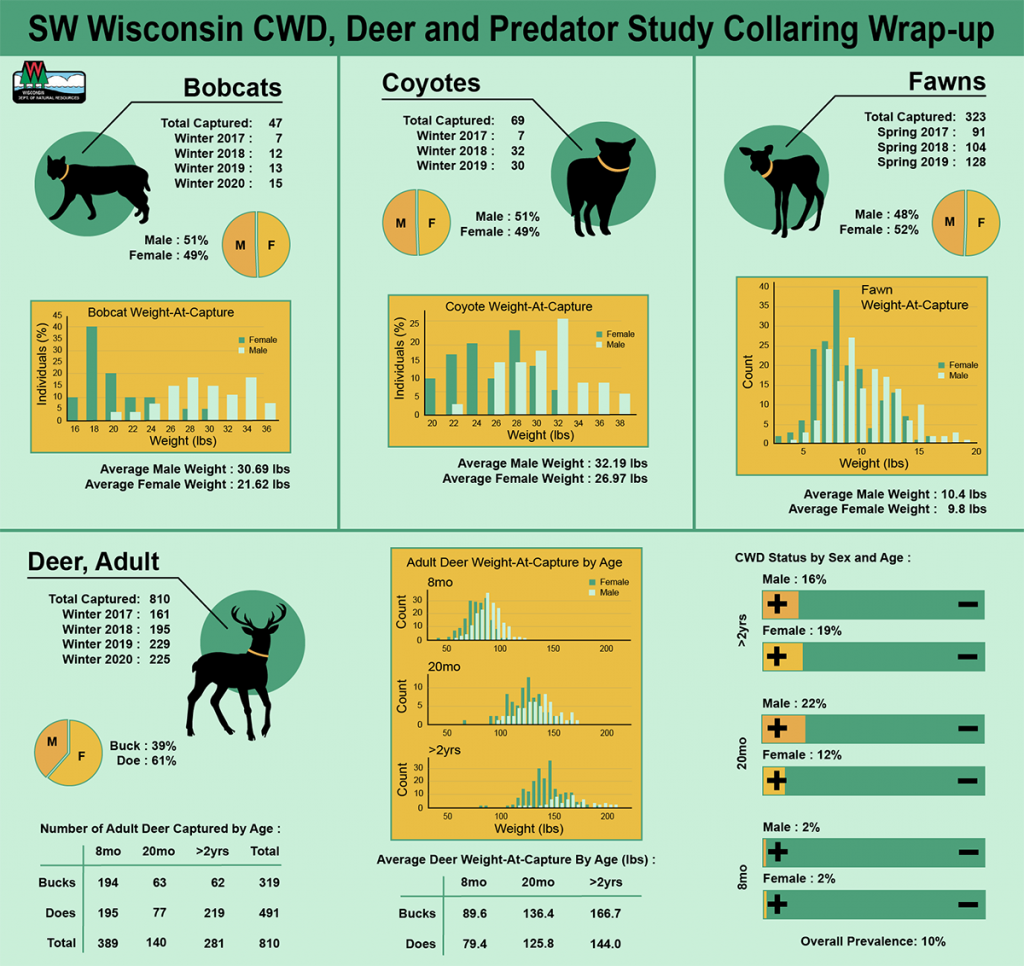
Below is a summary of the deer, bobcats and coyotes captured for the study from 2017-2020. Field crew stories and more information about Phase 1 field work can be found in the July 2020 edition of the project newsletter. The methods used for capturing and collaring are below.
Table with the final counts of captured individuals by species
| Species | Capture Season | ||||
| Season One | Season Two | Season Three | Season Four | Total Counts | |
| Deer, Adults | 161 | 195 | 229 | 225 | 810 |
| Fawns | 91 | 104 | 128 | * | 323 |
| Coyotes | 7 | 32 | 30 | ** | 69 |
| Bobcats | 7 | 12 | 13 | 15 | 47 |
| Total Counts | 266 | 343 | 400 | 240 | 1,249 |
* Due to the COVID-19 pandemic, fawn capture was canceled in 2020.
** Capture counts were high enough in the previous years, so efforts were redirected toward the other species.
HOW WE DO FIELDWORK
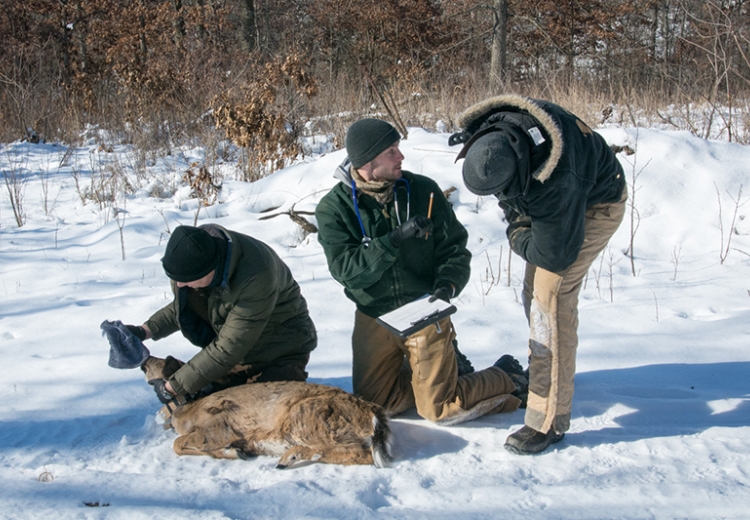
This four-year phase involved intensive field work and required a lot of coordination between staff and the public. Thank you to everyone who participated, whether as staff, volunteers or landowners who granted permission to trap on their land. Daniel Storm, the lead researcher for the project, wrote a special thank you note at the end of the November edition of the project newsletter. Here's how we captured and collared the study’s animals to monitor location and survival.
Netted Cage Traps
Netted cage traps were metal-framed traps, wrapped in netting with a single door that the deer walked through to get to the bait in the back of the trap. When the deer got to the bait, it bumped the trigger wire, strung about 6" off the ground inside the trap, and the netted door closed behind the deer.
Box Traps
Box traps were wooden traps with two doors (the bait side is blocked by hog wire) that the deer could only enter from one side. When the deer walked to the bait in the back of the trap, it bumped the trigger wire, strung about 6” off the ground inside the trap, and the two doors dropped to trap the deer.
Drop Nets
The drop nets we used were large nets suspended several feet off the ground that had a central trigger point that held up the net. When the deer came to the bait in the center of the net, the net operator triggered the net switch, and the net dropped on top of the deer.
Darting
Darting involved using a dart projector that shot a transmitter dart at a relatively low velocity to administer anesthesia to the deer. The dart attached to the deer transmits the deer's location to the capture team using a VHF frequency. Using this technique, deer were usually captured within 15 yards or less of the person who fired the dart.
Once an animal was captured, it was fitted with a tracking device to monitor the animal. We used four different monitoring devices for deer in this study.
VITs
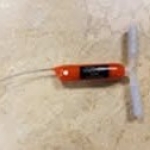
We used vaginal implant transmitters (VIT) to help us locate fawns born to do we have collared. The transmitter was implanted in the doe during the winter months. In the spring (May and June) when the doe gives birth, the transmitter sends a signal telling us that the doe possibly gave birth. Researchers then located the transmitter and the fawn(s) nearby for collaring. This type of monitoring allows us to track both the doe and fawn to examine the potential effects of predation and disease on doe-fawn pairs.
Collaring Does
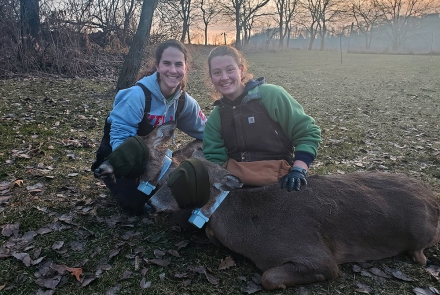
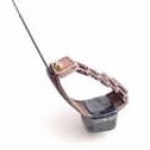
Does we captured were collared by researchers using standard GPS collars that don't expand. Researchers allowed for the growth of the doe by adding another inch or two of space when placing the collars on the does. The GPS collars send locations twice a day depending on environmental conditions (weather, tree canopy density and if the deer is in a valley or on a hill). Collars can even let researchers know if the collared deer has possibly died by sending a text message when the collar doesn't move for more than six hours.
Collaring Fawns
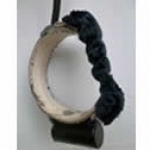
Fawns were collared using expandable drop-away VHF collars that have pleats sewn into the collar that pop and expand as the fawn grows. The elastic in the collar is designed to have the collar fall off within approximately 18 months of capture. Researchers used telemetry equipment to check the fawn’s location once per day to determine if the collared fawn had potentially died. The signal changes its pulse rate when the collar hasn't moved for more than 6-8 hours.
Collaring Bucks
Adult bucks were collared using expandable GPS collars that stretch during the rut and also have pleats that pop to allow the collar to expand as the bucks grow. The GPS collars send locations at least twice a day, depending on environmental conditions (weather, tree canopy density and topography). These collars also let researchers know if the buck hasn’t moved in six hours, potentially indicating mortality.
Collaboration with the Public
One approach for capturing bobcats and coyotes was to rely on trappers and landowners to voluntarily report captured bobcats and coyotes. Reported bobcats and coyotes were collared and released by the researchers. Thank you to the trappers and landowners who reported and helped our study!
Cage Traps
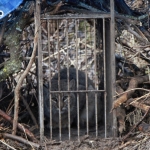
Researchers also used live traps as necessary, such as cage traps, to capture bobcats and coyotes. Scent lures and visual attractants were placed at the back of the cage. When the animal entered, it stepped on a treadle that closed the door behind it.
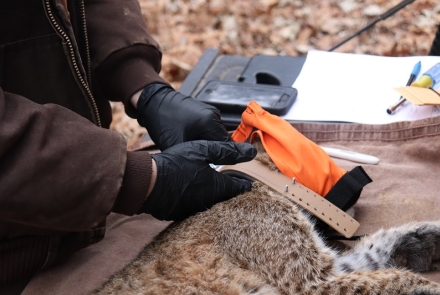
Bobcats and coyotes were fitted with GPS collars that record and transmit the location of the animal multiple times per day. The collars weigh five percent of the animal's weight or less, and researchers gave an extra inch or two of space to allow for growth. The collars were sent six to eight locations a day and alerted researchers when the collar was stationary for more than six hours.

