Remote Sensing: Research
Remote sensing research activities at the DNR include:
- adaptation of image processing protocols for the retrieval of water clarity to new satellite sensors and technological advancements in GIS and remote sensing software packages;
- systematic processing of Landsat 7 ETM+ and Landsat 8 OLI-TIRS data for the retrieval of water clarity;
- studies of the major drivers of lake water clarity, their interactions, and the potential impacts of land use and climate on water clarity (Rose et al., 2017);
- development of new interactive ways to present the satellite retrieved water clarity data for public use; and
- the increase in Earth observation monitoring capabilities through the optical and biogeochemical characterization of lakes in support of algorithm calibration, refinement, and validation.
Remote Sensing of Water Clarity
The satellite retrieval of water clarity requires several image processing steps. The image processing starts with the identification of Landsat 7 ETM+ SLC-off and Landsat 8 OLI-TIRS data for the State of Wisconsin in the Landsat Archive of the USGS EarthExplorer. Level 1 Terrain Precision (L1TP) corrected GeoTIFF data for a date range from 06/01 to 09/30 with less than 50% cloud cover are downloaded with the Bulk Download Application. The quantized and calibrated scaled digital numbers are rescaled to top of atmosphere spectral reflectance and clouds and cloud shadows are removed. The images are reprojected to the Wisconsin Transverse Mercator coordinate system and land, shallow waters, and aquatic vegetation are removed through several image processing steps. Images acquired on the same day are combined to a single mosaic image. The image processing concludes with the extraction of the spectral reflectance values for stations where on-the-ground Secchi depth data was collected within one week from the image acquisition date.
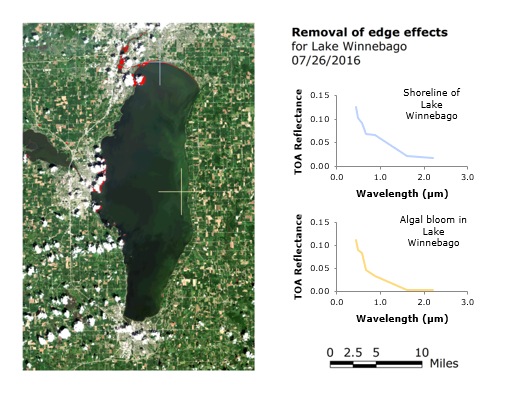
Differentiation of the shoreline and an algal bloom through unsupervised classification after the removal of land through a near-infrared image threshold for the Landsat 8 OLI images acquired on 07/26/2016. The spectral profiles represent the shoreline (top) and an algal bloom (bottom). The shoreline was removed from the images.
(Source of Landsat 8 OLI data: U.S. Geological Survey)
The on-the-ground Secchi depth data are collected with the support of Citizen Lake Monitoring Network volunteers and are accessible through the DNR's Surface Water Integrated Monitoring System (SWIMS). Stations in lakes at least 5 acres in size where on-the-ground Secchi depth data was collected within one week from the image acquisition date are identified for each mosaic image and the spectral reflectance values for these stations are extracted and used to calibrate a model for the satellite retrieval of water clarity.
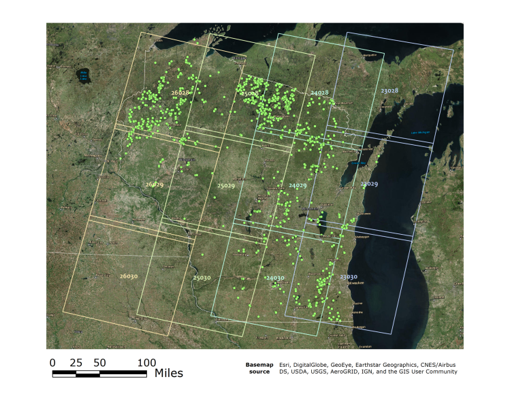
Distribution of stations with on-the-ground Secchi depth data collected in 2016 shown for the paths and rows of the Landsat Worldwide Reference System 2 in Wisconsin.
(Source of WRS-2 data: U.S. Geological Survey)
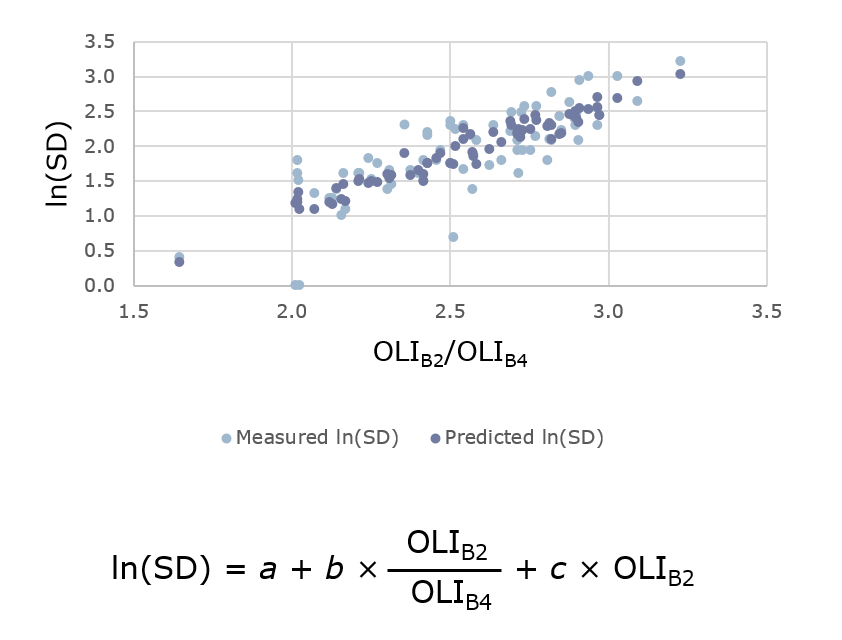
Model calibration for the satellite retrieval of water clarity for the Landsat 8 OLI images acquired on 07/26/2016. This model relates the top of atmosphere reflectance in the Landsat 8 OLI bands 2 and 4 (OLIB2 and OLIB4) to the natural logarithm of the Secchi depth (In(SD)).
The x-axis of this scatter chart shows the ratio of the top of atmosphere reflectance in the Landsat 8 OLI bands 2 and 4 (OLIB2 and OLIB4) for values from 1.5 to 3.5 and the y-axis shows the natural logarithm of the Secchi depth (ln(SD)) for values from 0.0 to 3.5. The chart includes a data series of the natural logarithm of the on-the-ground Secchi depth and a data series of the natural logarithm of the predicted Secchi depth. The data points indicate a close match of measured and predicted values. The model itself is formulated a + b(x1) + c(x2), where a, b, and c are constants, x1 is the ratio of the reflectance in bands 2 and 4, and x2 is the reflectance in band 2.
The calibrated model is used to produce summer water clarity maps for lakes across Wisconsin. These maps provide information to compare the variability in water clarity at the lake and regional level. Typical causes of the variability within a lake include the inflow of material from rivers and streams and changes in water temperature and wind direction. Some of these effects are seen in the map for Lake Winnebago from 07/26/2016. The spatial pattern of the algal bloom in eastern Lake Winnebago is affected by a light southwest wind on the image acquisition date.
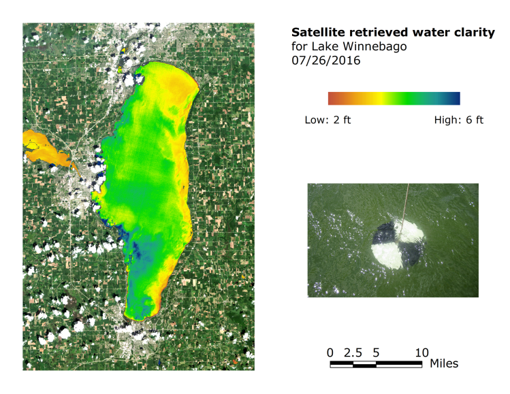
Satellite water clarity retrieval for Lake Winnebago on 07/26/2016.
(Source of Landsat 8 OLI data: U.S. Geological Survey)
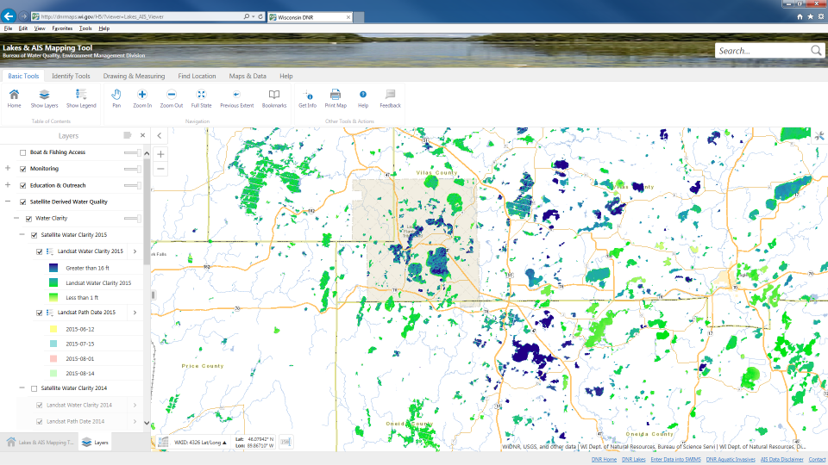
Satellite retrieved water clarity values within individual lakes are averaged to provide a single water clarity value for a lake for each image acquisition date. These values are submitted to SWIMS and accessible through the Lakes and Aquatic Invasive Species (AIS) Mapping Tool.
Reference
Rose, K.C., Greb, S.R., Diebel, M., and M. Turner (2017): Annual precipitation regulates spatial and temporal drivers of lake water clarity. Ecological Applications, 27(2), 632-643.