Wisconsin Water Quantity Monitoring
The DNR and our partners monitor streamflow, groundwater levels, lakes levels and springs to inform water management decisions that promote a balance between Wisconsin’s water resources, ecosystem health, public health, recreational opportunities and the economy.
Some of the important questions the DNR seeks to answer when measuring water levels are: how much water do we have and how does water availability vary across the state?
The DNR is responsible for keeping an up-to-date inventory of water resources as part of the Great Lakes Compact. To meet our goals, we collect annual water use data from water users across the state, alongside our efforts to monitor the flow of springs, streams and rivers, groundwater levels and lake elevations. The DNR’s water quantity monitoring StoryMap provides descriptions and maps of the sort of monitoring we conduct with our partners across the state. Search our water quantity data viewer (USGS monitoring layer - WI groundwater network wells) to see where groundwater data are recorded in Wisconsin.
Explore the tabs below to see how each resource is monitored in Wisconsin.
Springs
Springs
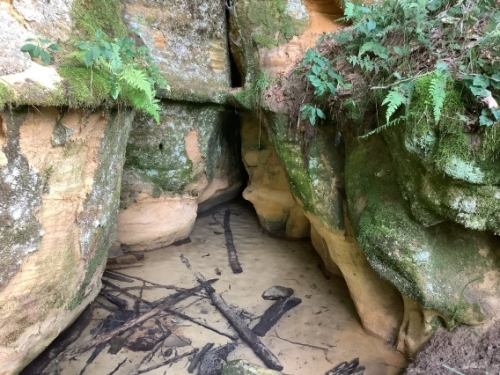
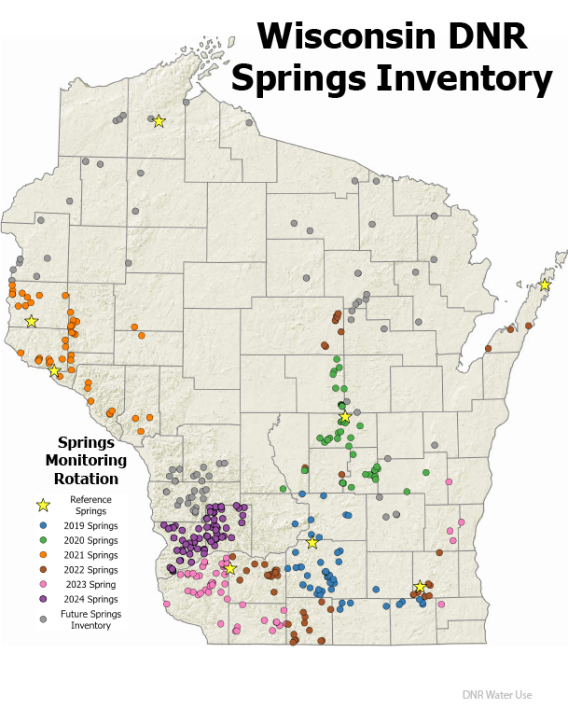
Springs are unique features that are places on the earth’s surface where groundwater emerges. To establish a baseline inventory of springs, the DNR supported a Wisconsin Geological and Natural History Survey (WGNHS) statewide inventory of over 400 springs in 2017. The DNR continues to monitor spring flow at these sites on a rotating basis (every 5-10 years). On a quarterly basis, the DNR monitors flow and chemistry at eight springs located in different regions of the state. The unique pattern of where springs are on the map is a function of geology, access and type of spring. The DNR places all data into the Surface Water Integrated Monitoring System (SWIMS) database.
Groundwater levels
Groundwater levels
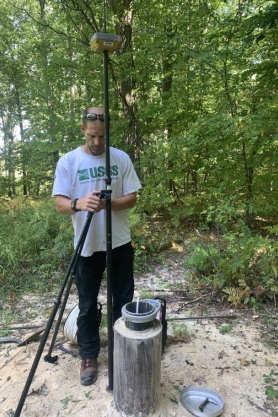
groundwater monitoring well.
The DNR analyzes groundwater-level data, such as groundwater elevation or depth to groundwater, to understand local and regional aquifer status. Those data are important for assessing drought and flooding conditions, calibrating decision-support tools such as groundwater flow models and evaluating relationships between withdrawals of groundwater and nearby springs, streams and lakes.
The DNR supports Wisconsin’s long-term groundwater monitoring network, a network of approximately 100 wells across the state. Our partners at United States Geological Survey (USGS) measure water levels either manually weekly, monthly, quarterly or continuously with pressure transducers, and perform quality checks on the data, and our partners at the WGNHS assist in well maintenance. Our partners at WGNHS and USGS maintain and monitor the wells, and USGS regularly does quality checks on the data. Check out this video by our WGNHS partners on the importance of the groundwater level monitoring network.
DNR and USGS also work together to install short-term project wells in areas of interest, such as Wisconsin’s Central Sand Region, and areas impacted by groundwater flooding or drought.
Streams
Streams
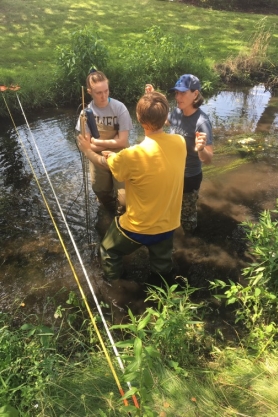
The DNR collects flow measurements on streams to quantify how groundwater level changes may influence the stream’s water levels and impact stream ecology. Over time, those streamflow measurements, referred to as baseflow, help the DNR understand the role groundwater plays in our state’s surface waters. For example, when baseflows are low, stream temperatures may be higher, which can stress fish and aquatic life.
The DNR, UW System and others collect river and streamflow measurements throughout Wisconsin. Our partners at the UW Stevens Point Center for Watershed Science have collected streamflow on over 50 sites across the Wisconsin’s Central Sands Region since 2005. In addition, staff at the USGS have installed and maintained gage stations on streams to continuously monitor both water levels and streamflow.
Search our water quantity data viewer (monitoring layer) to see where streamflows are recorded in Wisconsin.
Lake levels
Lake levels
Most of Wisconsin’s 15,000 lakes are directly or indirectly connected to the groundwater system, meaning some portion of the lake’s water level is dependent on groundwater. Multiple agencies, universities, conservation groups, volunteers and the DNR have measured lake levels since 1918.
There are three primary methods for measuring lake levels throughout Wisconsin: pressure transducers, staff gages or stilling wells. The DNR and volunteer data are uploaded into SWIMS.
Lake water levels can fluctuate naturally due to precipitation, which varies widely from season-to-season, year-to-year and across the state. However, the DNR’s Central Sands Lakes Study shows that groundwater withdrawals can impact levels beyond a lake’s natural fluctuations.
The DNR has created this interactive dashboard to explore lake level data.

