Snapshot Wisconsin February 2024
Snapshot Wisconsin trail cameras have collected millions of wildlife images throughout the course of the project, with 72.4% of these wildlife images being deer detections (Snapshot Wisconsin's Data Dashboard).
With nearly seven million deer detections in the database, Snapshot Wisconsin is a unique resource that has contributed and will continue to contribute, to a wide range of deer research topics and better-informed deer management decisions. From analyzing deer rut to abundance trends, here are examples of past, present and future deer research!
The Past: Analyzing the Rut & Deer Behavior Classifications
We review previous Snapshot Intern Mira Johnson's project analyzing the rut and the deer behavior research of PhD candidate John Clare.
Present Day: The Importance of Snapshot's Fawn to Doe Ratios
Every year, Snapshot data provides County Deer Advisory Committees with fawn-to-doe ratios. Learn about these ratios, how they're gathered and how they help inform county-level decision-making.
Looking Ahead: Refining a Population Modeling Tool
Take a look at how two DNR research scientists are refining the trail camera-based approach in order to improve population modeling.
The First Ever Supersnap Bracket
The public voted, and the results are in! Read on to find out which trail camera photo came out on top in Snapshot's first-ever Supersnap Bracket!
The Past: Analyzing the Rut & Deer Behavior Classifications
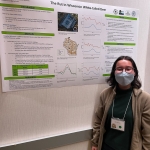
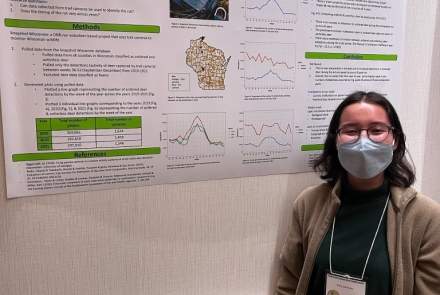
Mira Johnson: The Rut in Wisconsin White-Tail Deer
Looking back to the January 2023 Snapshot Wisconsin newsletter, Mira Johnson, an intern from the Natural Resources Foundation of Wisconsin's (NRF) Diversity in Conservation Internship Program, was wrangling the data from the Snapshot Wisconsin database for her summer research project. Johnson's goal was to determine if trail cameras could be used to identify the deer rut and if the timing of the rut varied across years.
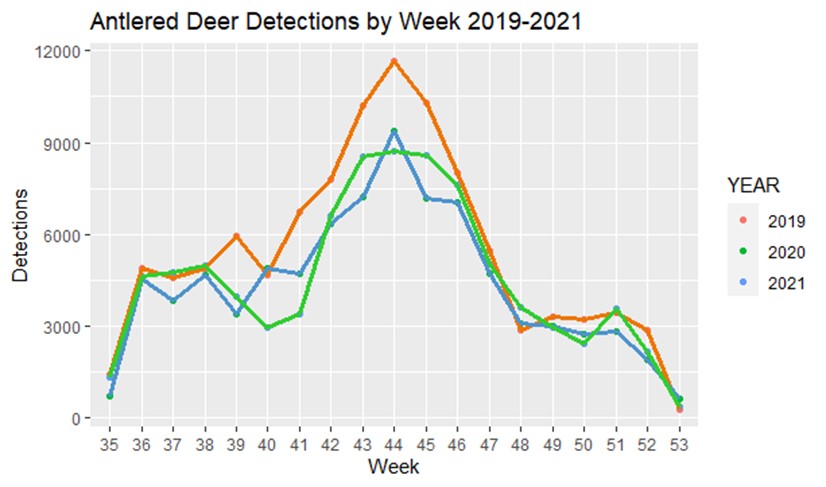
Using statewide Snapshot Wisconsin data from 2019-2021, Johnson pulled only the deer detections that occurred between weeks 36-52 or between September through December. After comparing the antlered deer detections by week, Johnson found a notable peak in rut activity that occurred during week 44 across all three years, which corresponds to late October or early November, depending on the year. "We knew we could see the rut happen on our trail cameras," Dr. Jen Stenglein, Wisconsin DNR Quantitative Research Scientist, explained, "but the question became, when does that happen? So, it was cool that there were extreme consistencies in the peak in antlered observations that happened on the same week in every single one of those years."
Johnson presented her findings at the 2023 Wisconsin Chapter of The Wildlife Society (WCTWS) winter meeting, where she won Best Undergraduate Student Poster, showcasing the possibilities of how Snapshot Wisconsin data can be used for deer research.
John Clare: Using Deer Behavior Classifications for Research Analysis
John Clare, a PhD student from UW-Madison, conducted a complex research study using Snapshot Wisconsin data collected throughout 2017. Clare sought to understand the fine-scale spatial and temporal changes in landscape use by deer, wolves and coyotes.
Clare found that certain deer behaviors, such as time spent in front of a trail camera or the probability of vigilant or foraging behaviors, were determined by seasonal changes and if wolves or coyotes were recently detected by the same camera. For instance, in rich foraging areas, deer spent more time in front of the camera and less time when there was more snow, which is to be expected. However, the time deer spent in front of the camera in these rich areas increased when wolves were recently detected on the trail camera. Although you wouldn't anticipate deer to increase their time spent in front of a trail camera when wolves were recently seen, this finding indicates that when deer are in spaces with good forage, they tend to prioritize eating despite predation risk. They may mitigate this risk by increasing vigilant behavior during this time.
How did Clare collect unique deer behavior data, such as vigilance or time spent foraging? With the help of deer behavior classifications made on Snapshot Wisconsin's online crowdsourcing site, Zooniverse! When classifying trail camera images that have deer present, Zooniverse volunteers can select from a variety of deer behaviors that they might notice in the image, such as vigilance, moving, foraging and resting. Clare's research was the first time behavior collected from the Snapshot Wisconsin trail cameras were directly used in an analysis. That would not have been possible without the dedicated time and effort of volunteers on Zooniverse!
Clare published a paper on this complex research study in 2023, which can be found on Snapshot Wisconsin's Scientific Publication page.
Present Day: The Importance of Snapshot's Fawn to Doe Ratios
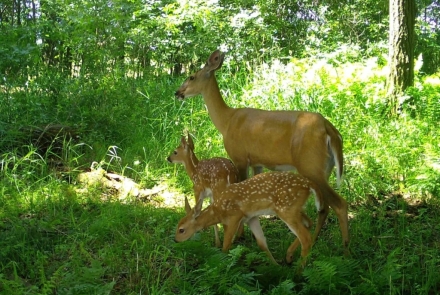
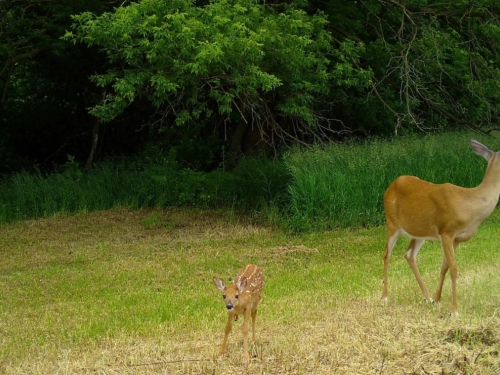
Each year, and for every county in Wisconsin, the Wisconsin DNR estimates the annual recruitment of white-tailed deer. Recruitment is how many new individuals are added to a population each year, and, in the case of white-tailed deer, an important indicator of this is a fawn-to-doe ratio. Having an accurate estimate of this metric can inform county-level management decisions and help set harvest recommendations for future deer hunting seasons.
When making decisions, management agencies consider data from a few different inputs, the first of which are annual Summer Deer Observation Surveys. These observation surveys run from August to September and are completed by people working within the ecological sector, such as biologists or state employees who spend ample time in the field. Another contributor is Operation Deer Watch. This community science project runs simultaneously, allowing any public member to contribute deer observations via an online web form. While both data sets are valuable, they may over-count deer on roads and during certain times of the day.
In 2017, Snapshot Wisconsin began using their statewide network of trail cameras to supplement these two deer observation surveys. "Snapshot trail camera data brings a consistency to that monitoring," says Stenglein. Knowing the date, time and location for each of Snapshot's deer photos provides managers with a more robust dataset and helps mitigate common temporal and spatial errors that can arise from solely using in-person reporting.
Temporal errors relate to time, and spatial errors relate to place. If people are your only source of reports, chances are you will get more deer sightings in places people are more likely to go at the times they are most likely to go there. This can mean higher reported incidence of deer near roads, trails and in more populated counties, and higher reported incidence during daylight hours. "One other thing we've noticed," Stenglein explains "is that deer detections between fawns and does are different throughout the day." Snapshot trail cameras help balance this out by utilizing motion sensor lenses that can operate continuously and by placing them in various habitat types across the state.
The estimated fawn-to-doe ratios that Snapshot cameras provide are given, along with findings from the Summer Deer Observation Survey and Operation Deer Watch, to County Deer Advisory Councils (CDAC). The CDACs can then consider all the information provided when making harvest quota recommendations and establish what changes, if any, will be needed to maintain, increase or decrease the herds. While this began in 2017, it has continued through the present and proves that Snapshot can be a valuable tool for informing management decisions. "It is a really important piece of biological information for us to track the health, wellbeing and status of the deer herd," Stenglein affirmed. As we look toward the future of wildlife population modeling, Snapshot scientists are constantly looking for new and innovative ways to make trail camera data as accurate and effective as possible.
Looking Ahead: Refining a Population Modeling Tool
Estimating the abundance of deer populations, or any animal for that matter, can be hard for a variety of reasons. That's why new research led by DNR research scientists Dr. Jennifer Stenglein and Dr. Glenn Stauffer seeks to tackle these common obstacles and fine-tune population estimators using a trail-camera-based approach.
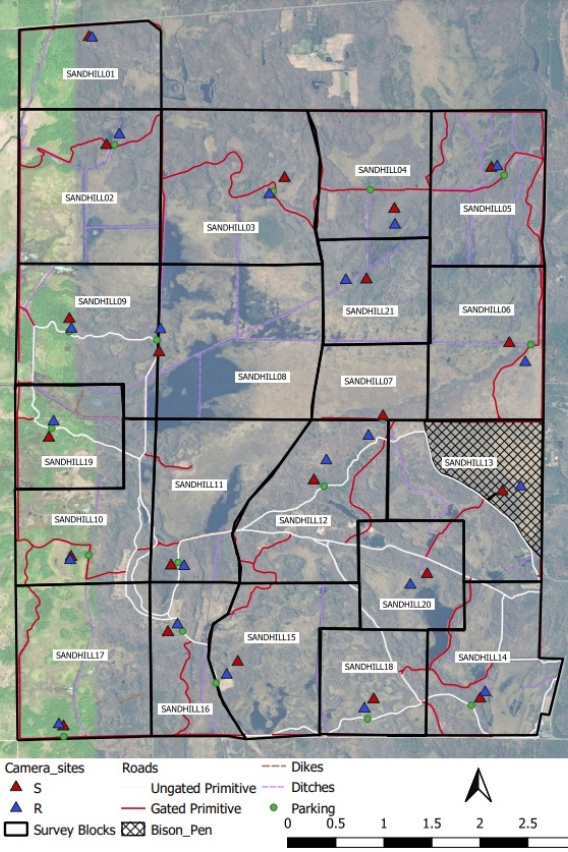
Sandhill Wildlife Area offers a unique opportunity to study these metrics because its deer population, spread across 14 square miles, is entirely fenced in. This allows researchers to concentrate more on the variables in question without worrying about deer leaving or moving into the study area.
So, how exactly are scientists studying these variables? Let's break it down.
Spread throughout Sandhill are 21 pairs of cameras or 42 in total. For each pair, one is placed in a strategic location, i.e., alongside a trail, and the other is placed at a location randomly chosen that is within 200 meters of the first. This helps to account for the first obstacle, randomness. Many methods for estimating animal abundance from trail camera data require that cameras be placed randomly with respect to animal movement. However, Snapshot cameras are typically placed along wildlife trails. So, when comparing the strategic and random cameras, scientists need to see if the photo data they are collecting produces different population estimates and, if so, how they can build corrections between the two.
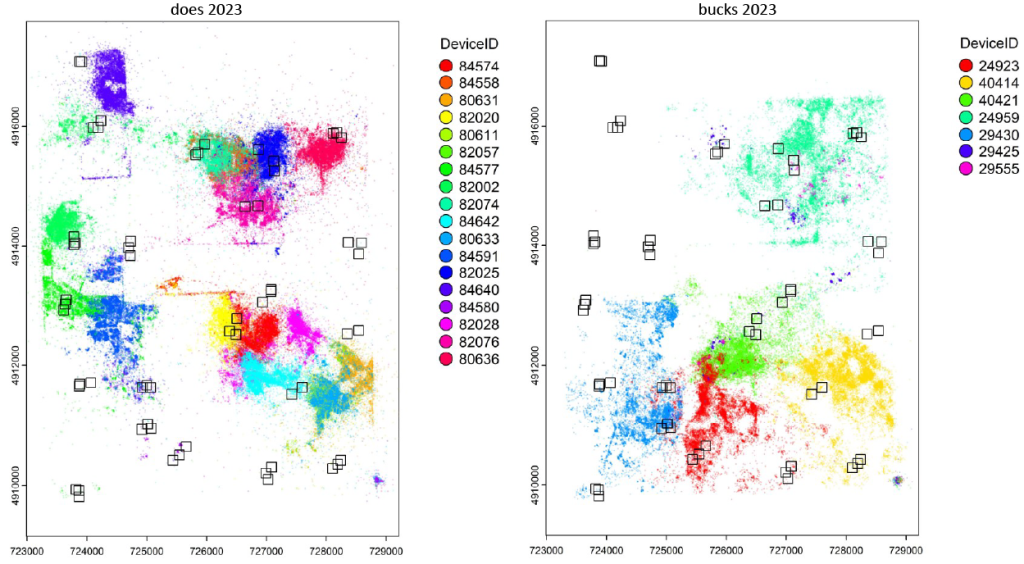
To better understand how deer movement might vary in front of these strategic and random cameras, scientists have also radio-collared some of Sandhill's bucks and does. The map below depicts various locations for several of these deer.
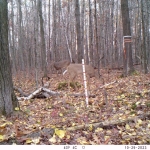
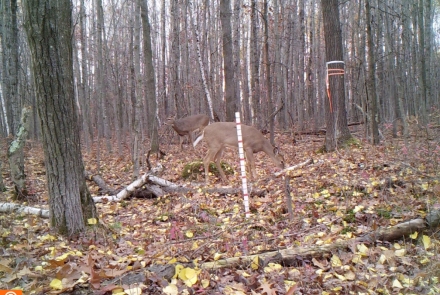
Additionally, researchers are using markers near these cameras to measure distance. A post located 5m away from the trail camera and a flag located 15m away gives an estimate of how far the deer in the photos are, both from the camera and other objects within the environment. This provides further options for scientists to utilize distance sampling to determine population density and abundance.
The last obstacle this project seeks to address is cameras potentially missing deer that walk by. Motion trigger trail cameras are common and generally effective, but it is nearly impossible to guarantee that the motion trigger works to capture every deer. For example, a motion-trigger photo that is blank may mean that an animal ran by, but the camera was too slow to capture it. That's why camera pairs at Sandhill are designed to take motion trigger photos in addition to a photo every 15 minutes. This results in a lot of extra photo data, but it ensures scientists are missing as few detections as possible.
An important feature of a population estimate is how sensitive it is to changes in the population. The Sandhill research station provides a unique opportunity to experimentally manipulate the population in a way that can't be done in the wild. In the fall of 2023, three hunts (the annual Learn to Hunt Deer program plus additional gun and archery hunts) were facilitated to reduce the Sandhill deer population by about 50%. Analysis of data from this decline and the subsequent rebuilding of the herd will provide us with valuable data on the sensitivity of the camera-based estimates. With a few years left in the study, these hunts will help determine if the trail camera network can accurately detect population changes and allow the research team to adjust as needed. The results will improve how we use Snapshot Wisconsin data to monitor deer and other species. It will also better inform management agencies of best practices for building trail camera networks and create new opportunities for utilizing pre-existing networks, like Snapshot Wisconsin, in future population modeling.
The First Ever Supersnap Bracket
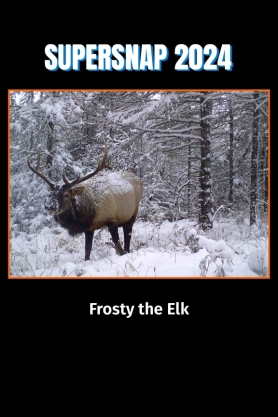
The results are in! The first-ever Supersnap Bracket took place in January, with DNR followers able to vote for their favorite photo via Instagram stories. It was stiff competition, but the uncontested winner was...Frosty the Elk!
This bracket was a fun way to celebrate Snapshot's 50th season on Zooniverse by showcasing some of the amazing photos our volunteers have captured to date. And if you haven't had a chance to participate in the celebration, it's not too late! With only about 85% of our 100,000 images classified, you can still head over to Zooniverse and get in on the classification action today!

