BOD Toxicity
Sample toxicity
- Often referred to as "sliding" BODs
- BOD decreases as sample volume increases (i.e., less dilute)
- Occurs frequently in systems receiving industrial waste
- Amounts to killing off (or severe shock to) "the bugs"
- Results in under-reporting the BOD for a waste
- Failure to mix sample between dilutions can look like toxicity
- Even pH adjustments can result in this effect
- Poor technique (pipetting, pouring samples) can also mimic toxicity
- Sometimes we just can't determine the root cause (isolated cases)
If nitrification is occurring (remember: dilution water contains NH3):
- as dilution increases, available NH3 increases (due to more dilution water) → final BOD increases
- if sample has high levels of NH3, the opposite effect can occur, and BOD appears to drop as the dilution increases (due to less available ammonia)
What does toxicity look like?
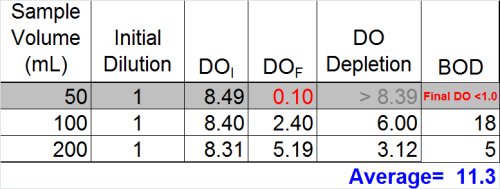
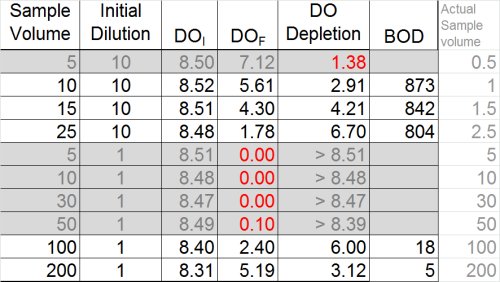
A toxic sample could look very much like the example below. In fact, toxicity can be insidious if only a single dilution meets depletion acceptance criteria. This is because operators have become programmed not to consider any dilution results for which the depletion exceed method-specified criteria.
So … what we have is two dilutions--one with a BOD of 5 and the other with a BOD of 18 mg/L. While this isn't the best precision in the world, many operators might be inclined to stop here and report the average of the two dilutions (11)
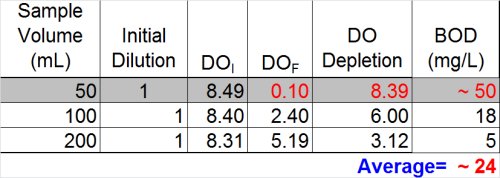
Ultimately, however, now is the time to at least evaluate the other data we have and see what it tells us. If we look at the dilution that over-depleted (see below) we can see that --if calculated assuming a final DO of 0.1 mg/L was acceptable-- the result would be at least 50 mg/L. Now, the THREE results- 5, 18, and 50 mg/L-- look much more suspicious.
So what do we report for this sample?
- Do not report the "average" of dilutions (11.3)
- Do not report the highest value (18)
- Best answer: report ">" plus the highest BOD determined from any of the dilutions (> 18)
- Furthermore, you must qualify these results as exhibiting "toxicity"
Typically, as long-time analysts well know, BOD is a really a "one-shot" deal. That is to say that because it's a 5-day test, the sample holding time has been exceeded, and 5-days have passed. Therefore, one cannot just re-analyze the sample, as might be an option with TSS, ammonia, or phosphorus. Additionally, if this was truly just a unique event of a slug of toxic material coming from somewhere within the system, then it's too late to do any follow-up testing. The toxics are long gone from the system.
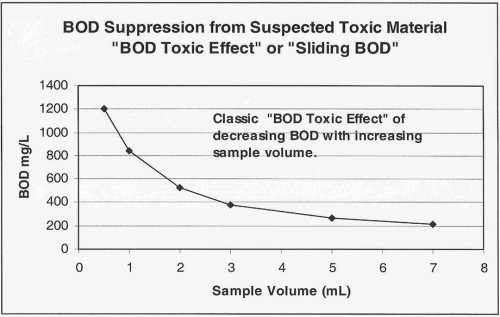
If, however, you are dealing with a waste source that you receive on a more consistent basis, such as that from a dairy or a small industrial facility, the best approach is to (with the next event) perform additional dilutions to better characterize the BOD loading derived from the waste source. Results of this testing plotted as BOD vs. mL of sample used might look like the example below.
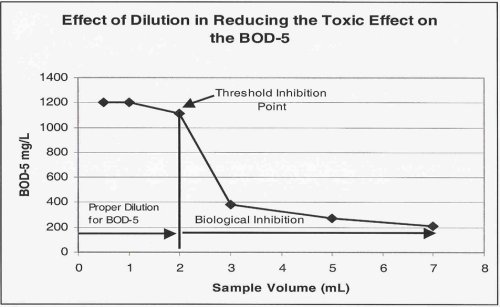
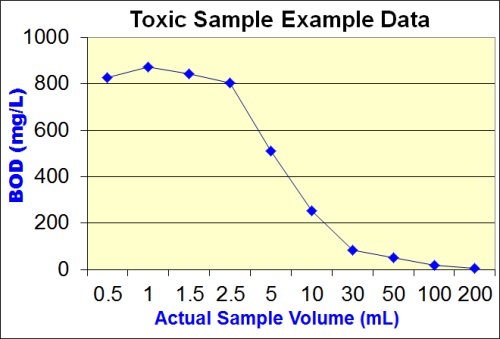
The goal of the additional dilutions is to identify the point at which the toxic effect has been successfully diluted out. This point is termed the "Threshold Inhibition Point" and is best characterized as the point at which the plot of sample volume vs. BOD begins to flatten out or "plateau".
If the analyst were to increase the number of dilutions to 10, covering the range from 200 mLs of original sample down to 0.5 mLs of sample (using an initial dilution, of course), the data might look like the following.
Unfortunately again, we find many dilutions either over-deplete or under-deplete, leaving us with the following BOD data: 5, 18, 804, 842, and 873 mg/L. These are still not good results, and the upper values suggest the toxic effect has not been completely diluted out.
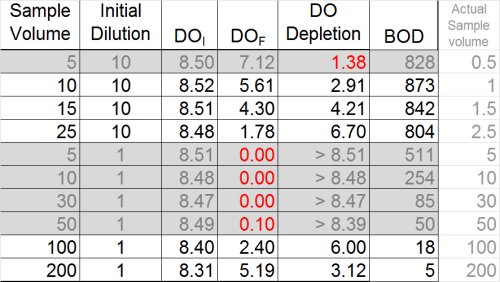
Once again, however, we need to look at ALL the data to discern the "big picture". In the table below, BOD has been calculated for all dilutions, whether or not they met depletion criteria, in an effort to determine whether the plateau or "Threshold Inhibition Point" has been achieved.
By doing this, a clearer pattern emerges, and it also by reviewing results for the most dilute sample (828 mg/L), it appears that the plateau has indeed been reached. With this last bit of information, it becomes clearer that the values 804, 842, and 873 could be averaged for a BOD of 840 mg/L. This is a far cry from the value of 11.3 that could have inadvertently been reported.
The image below shows graphically the classic "sliding" BOD as well as the "Threshold Inhibition Point".
In summary, the following table illustrates the best dilutions to obtain a solid BOD result for this sample. Of course, this would not be possible without having explored the toxicity more thoroughly.
Another example
| -------- Sample volume/bottle, mL -------- | |||||
| 25 mLs | 75 mLs | 200 mLs | 300 mLs | Average | |
| Replicate #1, cBOD5 | 29 | 23 | 9 | 6 | 17 |
| Replicate #2, cBOD5 | 28 | 18 | 10 | 6 | 15 |
| Replicate #3, cBOD5 | 34 | 16 | 10 | 6 | 16 |
| ----------------------------------------------------- | |||||
| Average cBOD5 | 30 | 19 | 10 | 6 | |
It has been argued that "...there is no evidence that the above sample contains toxic materials because this was an effluent from a well-operating plant that essentially provided complete nitrification. If the same amount of seed was added to each bottle, the lower dilution could have a higher relative reaction rate. In any case, the results of all dilutions should be averaged if all meet the minimum DO and minimum depletion criteria, and none is a qualified outlier."
Reporting suspected toxicity - what Standard Methods has to say
- Standard Methods, 21st ed.
- Identify samples in test reports when serial dilutions show more than 30% between high and low values.

