Field Notes January 2025
HOW DOES CWD AFFECT WISCONSIN'S DEER POPULATION
Want to get notified when new newsletters come out? Sign up for the following topics on GovDelivery.
- Chronic Wasting Disease Updates - For emails about new project newsletters.
- Wisconsin Deer Research - For email updates on all deer projects being done by the Office of Applied Science.
For more Field Notes newsletters, please see the Field Notes Newsletter Index.
Over 1,200 animals were collared, an unprecedented amount of data was collected, and countless hours were spent analyzing. In this edition of the Field Notes Newsletter, we announce the primary results of the Southwest Wisconsin CWD, Deer and Predator Study. While additional findings will be announced as they become available, we will break down each of the study's primary objectives and their corresponding results here.
Objective Recap
We recap the study's two primary objectives, which were laid out when the study first began.
Unprecedented Analysis
We discuss what makes the Southwest Study so unique, from its sheer size to novel model integration factors.
Primary Results
Here, we provide the primary results for each of the study's two main objectives.
What Does This Mean For Wisconsin Deer
Context is provided. Here, we break down the key takeaways stemming from these results.
What's Next
We discuss the study's next steps, including additional information still to come, and where to find it once it is released.
Objective Recap
Fieldwork during phase 1 of the Southwest Wisconsin CWD, Deer and Predator Study saw data collection from over 1,200 captured animals (adult deer, fawns, coyotes and bobcats) in northern Iowa, Dane and Grant counties. This region is where chronic wasting disease (CWD) was first detected in Wisconsin in 2002 and, over the years, has seen an increase in CWD prevalence. Phase 2 then began to analyze that data in order to fuel the study's research objectives. These objectives included:
- Estimate survival rates as a function of time, CWD infection status, age and sex. Document the breakdown of causes of mortality (i.e., starvation, disease, predation and hunting) and how these differ by CWD infection status and sex.
- Integrating survival estimates of CWD-infected and uninfected deer and recruitment (pregnancy rates and fawn survival) into an age-structured population model to determine deer population response across a gradient of CWD prevalence.
Unprecedented Analysis
The sheer size of the Southwest Wisconsin CWD, Deer and Predator Study has been unprecedented in size. It involved collaborations between the Wisconsin DNR's Office of Applied Science, the USGS National Wildlife Health Center, the Wisconsin Wildlife Cooperative Research Unit, the UW-Madison Department of Forest & Wildlife Ecology and the Montana Wildlife Cooperative Research Unit. The study also could not have occurred without the hundreds of private landowners throughout southwest Wisconsin who graciously allowed their properties to be used for animal capture.
The sample size of this project is notable as well. While there have been previous research projects to estimate deer survival, relatively few have ever explicitly focused on how CWD might affect it. Those that have were focused in the Western U.S. and had sample sizes ranging from 136 to 217 collared cervids. To put that into perspective, the Southwest Wisconsin CWD Deer and Predator Study deployed 1,089 collars on white-tailed deer (766 adult and 323 fawns), not to mention additional coyote and bobcat captures.
The model used to estimate survival is novel in that it can account for an animal's changing disease status, such as deer that were CWD-negative at capture but later acquired the disease. It also needs to be taken into account how survival differed over time and among sex and age groups. Prior to this study, survival models had never before incorporated all of these these elements of disease, and to do so here required tremendous patience and innovation. As a direct result of this patience and innovation, that we present the results of the Southwest Wisconsin CWD, Deer and Predator Study below.
Primary Results
Objective 1 Results
Objective one saw scientists analyze various causes of death within their sample of collared white-tailed deer. The differences in survival between CWD-infected and uninfected deer over one year are listed in the table below.
Annual Survival Probability
| Uninfected | CWD-Infected | |
| Females | 83% | 41% |
| Males | 69% | 17% |
These figures indicate that CWD substantially reduces the annual survival probability of both male and female white-tailed deer. Note how the above survival probabilities are averaged across the years of the study and ages (1 year of age and older). Once deer reached one year of age, annual survival did not differ much. However, there were some differences in survival between years. In particular, survival rates during 2018 and 2020 were somewhat lower than survival rates during 2017, 2019 and 2021. This lines up with the deer harvest patterns we observed during those years, which were higher in 2018 and 2020.
While the table above highlights key takeaways from this objective, previously completed additional analysis examines fawn and adult deer survival further.
- Fawn survival: Fawn survival in the study area was high enough to help sustain the population. Coyote predation was the highest source of mortality, followed by disease (pneumonia or enterocolitis), hunter harvest and human-related causes (car collisions, haying equipment, domestic dogs).
- Adult deer survival: Uninfected deer have high survival rates. CWD substantially reduces that survival rate and is closely associated with severe starvation and loss of bone marrow fat. Additionally, 51% of necropsied deer in the study had pneumonia, with bronchopneumonia more commonly found in CWD-positive deer.
Objective 2 Results
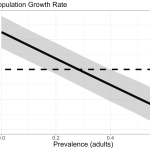
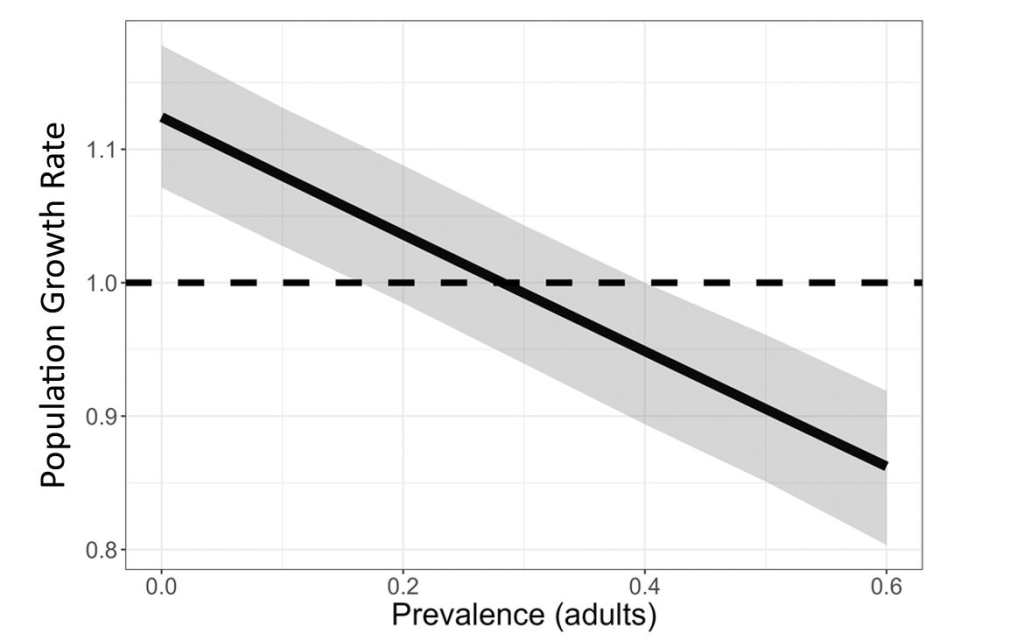
The survival estimates referenced above were combined with data on deer recruitment into a population model, which allowed researchers to determine how deer population growth changes across a range of CWD prevalence levels. This includes an estimate of the CWD prevalence threshold, which indicates the percentage at which CWD infection within a population will begin to cause population declines.
The graph below depicts the relationship between CWD prevalence and deer population growth rate. The y-axis shows the population growth rate. Specifically, this tells us how much a population increases or decreases over a given period; a growth rate greater than 1 means the population is growing, whereas a value less than 1 indicates a decline. The x-axis here is denoted as prevalence within adult deer. This refers to the percentage of adult deer in the population infected with CWD (i.e., 0.0 = none infected and 0.6 = 60% infected). Within the graph itself, the dashed line provides a reference for population equilibrium, so when the straight line is above the dashed line, the population is growing, and when it is below that dashed line, the population is declining. Results from this study indicate that when the CWD prevalence among females surpasses about 29% (where the two lines intersect), deer populations are expected to decline.
What Does This Mean for Wisconsin Deer
The key takeaways from these results are:
- CWD substantially reduces deer survival rates and suppresses population growth.
- Where CWD prevalence is high, deer populations are likely declining.
- If CWD continues to spread, it will eventually impact deer populations elsewhere.
While our research shows the general relationship between CWD prevalence and deer population growth, varying local conditions, such as harvest and recruitment rates, will play a role in the deer population trend that is ultimately observed. It is important to note that researchers do not expect CWD-affected deer herds to become extirpated (locally extinct). Deer populations have a strong ability to increase reproduction when deer abundance is lower, due to less competition for food and space.
What's Next
The results presented here are the primary findings of the Southwest Wisconsin CWD, Deer and Predator Study. The scope of this study provides us with a rich dataset from which we can continue to learn about our deer herd and CWD's impact. At the same time, this was a novel study, and there will still be more results, including cause-specific mortality rates, to come moving forward. As this analysis continues, information will continue to be released to the public.
These results will inform population management in currently infected areas and the agency's future CWD management decisions. For areas currently seeing low or undetected CWD, this research may provide a glimpse of the future should CWD continue to spread as it has over the past 20+ years. The DNR's current approach to managing CWD in Wisconsin can be found via the CWD Response Plan.
Furthermore, the following additional analyses are still underway:
- Bobcat and Coyote Movement and Habitat Use - This analysis will inform scientists which areas each species favors or avoids. It will provide a better understanding of how predators fit into the bigger picture of deer survival.
- Seasonal Deer Movement and Habitat Use - This will tell researchers how deer respond to seasonal changes in the environment and where there are likely higher rates of CWD transmission.
- The Impact of CWD on Deer Movement - This will shed light on how deer movement changes once they are infected with CWD. The analysis will also look for sex, age and seasonal patterns.
- Deer Contact Rates - This analysis will look for contact networks among deer and how CWD is likely being spread between them.
The results of these additional analyses will also continue to be reported upon in the Field Notes newsletter as they are completed.


